The importance of time
Sampling rates
All sensors sample at an independent rate. Stated another way, different sensors generate a signal at different times and at different intervals. Some sensors such as scanners create a signal of a specific duration. Figure 8 shows conceptual the relationship between the sample times of five different sensors. The signals from the sensors are shown as boxes. The position of the boxes shows the relative occurrence of the signal. The width of the box shows the relative duration of the signal. The distance between boxes on the same row shows the relative sampling rate of the sensor.
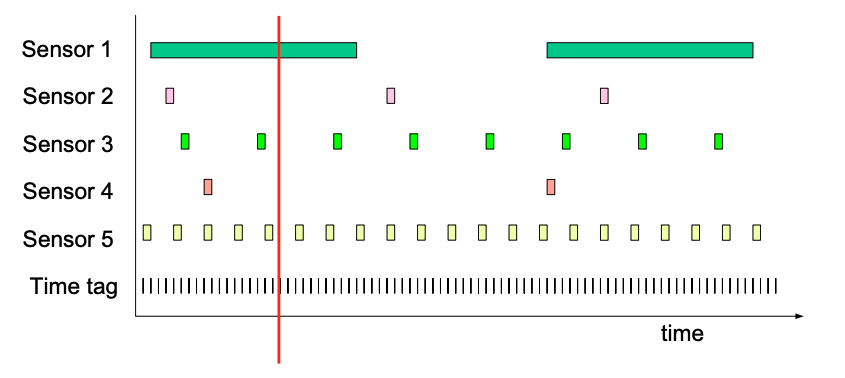
Figure 8 Sample time of different sensors
In legacy sensor systems, the interdependencies between the sensors are hard coded. Likewise, the differences in the sampling rates of the various sensors are obscured and association is nearly arbitrary. Figure 9 shows conceptually how a legacy sensor data format combines sensor data. The format is an image with metadata in its headers. All time relations have been stripped from the data. In such a legacy format, there is no easy or direct means for interpolating data from the various sensors for higher accuracy.
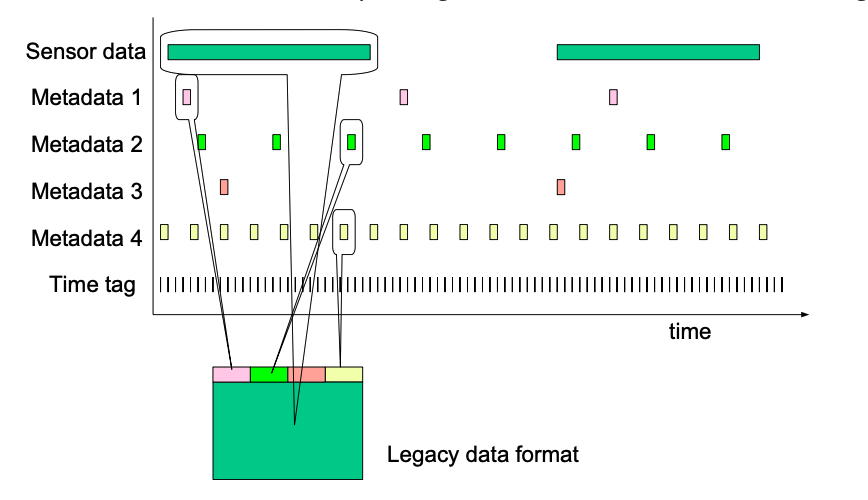
Figure 9 Combination of sensor data in legacy format
Interpolation example
We will now return to the example sensor platform shown in Figure 6. The platform consisted of an IMU, a GPS, a rotational encoder and an imaging sensor. To extend this example, we will assume that the imaging sensor is a scanner that samples 120 lines at equal increments. The following table shows the sensor readings with timestamps as they would appear. Note that the image data appears 120 time increments after it began, but it is stamped with its beginning time. The other sensors are treated as instantaneous.
- 4 IMU
- 12 gimbal
- 27 GPS
- 36 gimbal
- 37 IMU
- 60 gimbal
- 70 IMU
- 77 GPS
- 84 gimbal
- 103 IMU
- 108 gimbal
- 0 image
- 136 IMU
- 127 GPS
- 132 gimbal
- 156 gimbal
- 169 IMU
- 177 GPS
- 180 gimbal
- 202 IMU
- 204 gimbal
- 227 GPS
- 228 gimbal
- 235 IMU
- 120 image
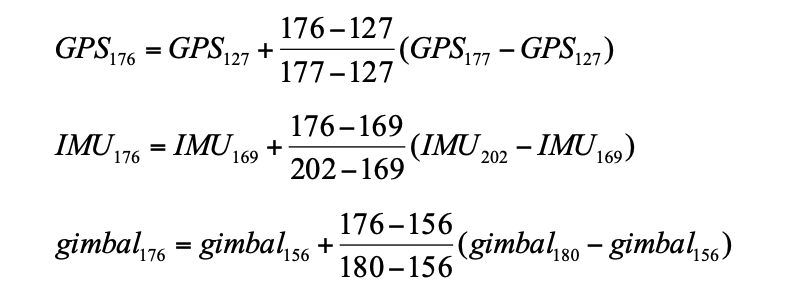
We wish to calculate the exact position of the 56 line of the second image. The time of that line would be the time the image began plus 55, or 176. For the rest of the calculations, we will use first order interpolation.
Sample data
The following figures are intended to contrast the legacy data format with the new sensor fusion data format. In traditional sensor systems, a set of readings are assigned as metadata to a photograph as shown in figure 10.
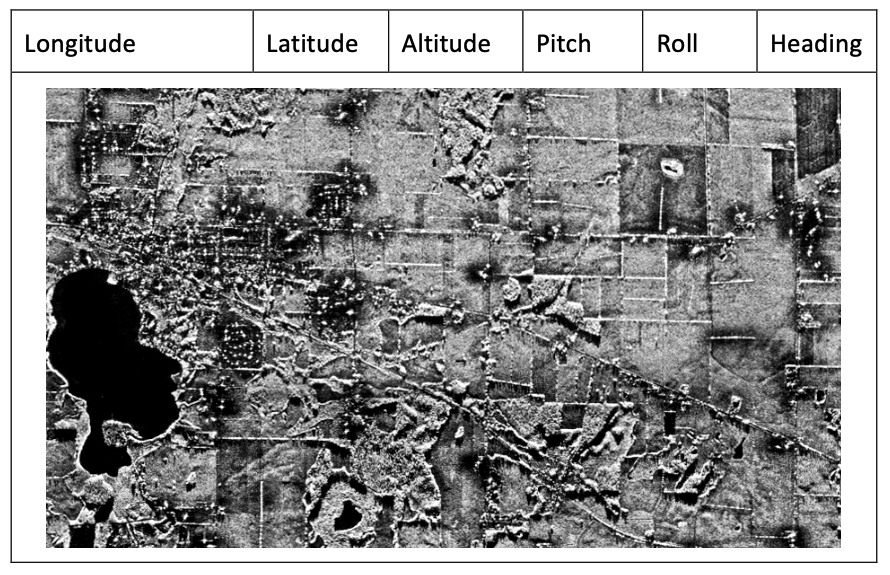
Figure 10 Conceptual legacy sensor data format, with metadata in header
In a streaming sensor fusion system, sections of the photograph can be interpolated with more accuracy with a series of other sensor readings.
| time | sensor reading |
|---|---|
| 2456 | latitude, longitude, altitude |
| 2635 |  |
| 2762 | pitch, roll, heading |
| 2789 |  |
| 2812 | latitude, longitude, altitude |
| 2893 |  |
| 2910 | pitch, roll, heading |
| 2998 |  |
| 3015 | latitude, longitude, altitude |
| 3075 |  |
| 3147 | pitch, roll, heading |
| 3222 |  |
| 3354 | latitude, longitude, altitude |
| 3389 |  |
Figure 11 Conceptual transducer data format